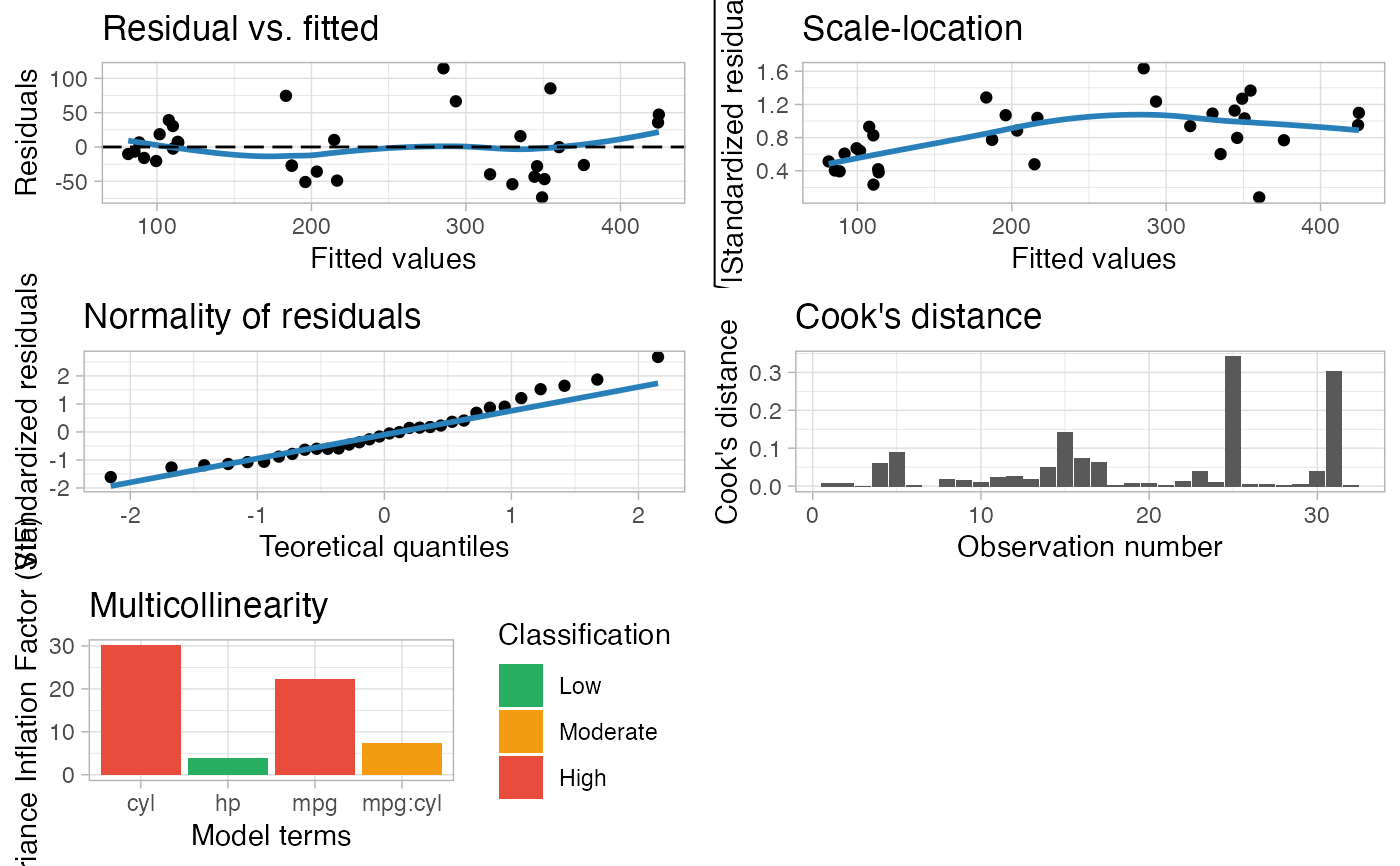
Plotting functions for some common model diagnostics.
plot_model(model)

plot_model_residual_fitted(model)

plot_model_scale_location(model)

plot_model_qq(model)

plot_model_cooks_distance(model)

plot_model_multicollinearity(model)
Arguments
| model | An object containing a model. |
|---|
Value
A ggplot object.
Details
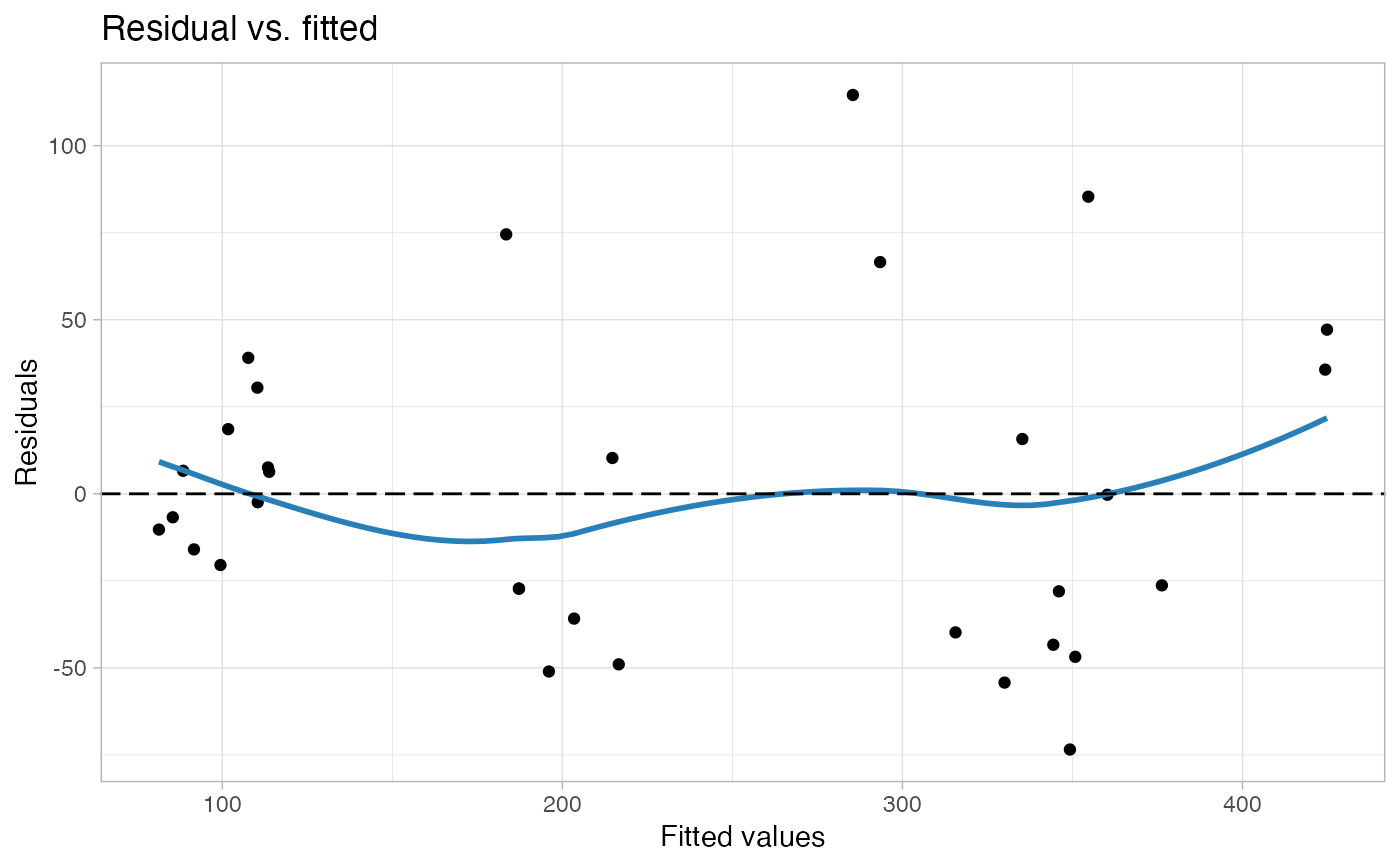
plot_model_residual_fitted() plots the model residuals
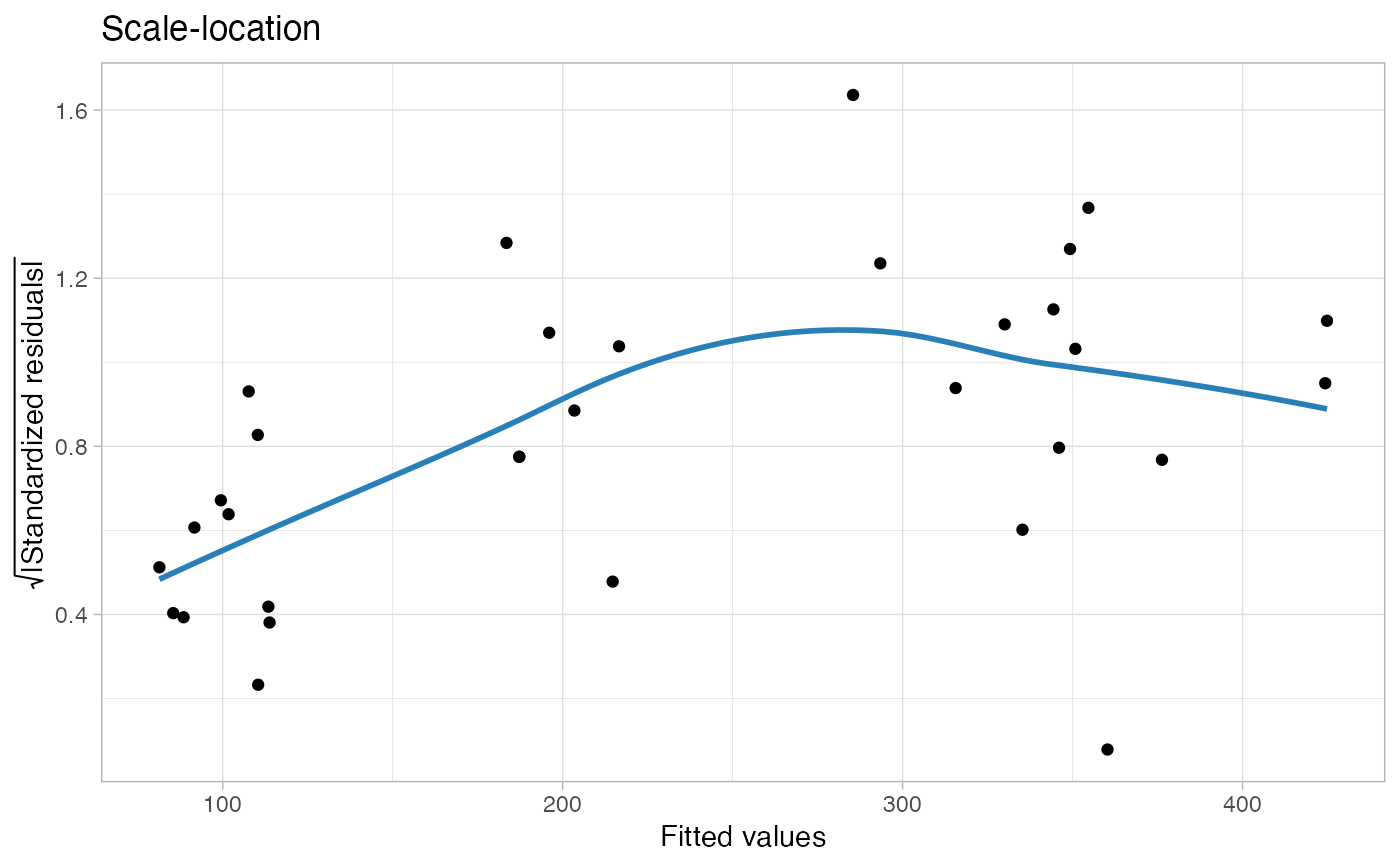
versus the fitted values. plot_model_scale_location() plots the
square root of absolute value of the model residuals versus the fitted
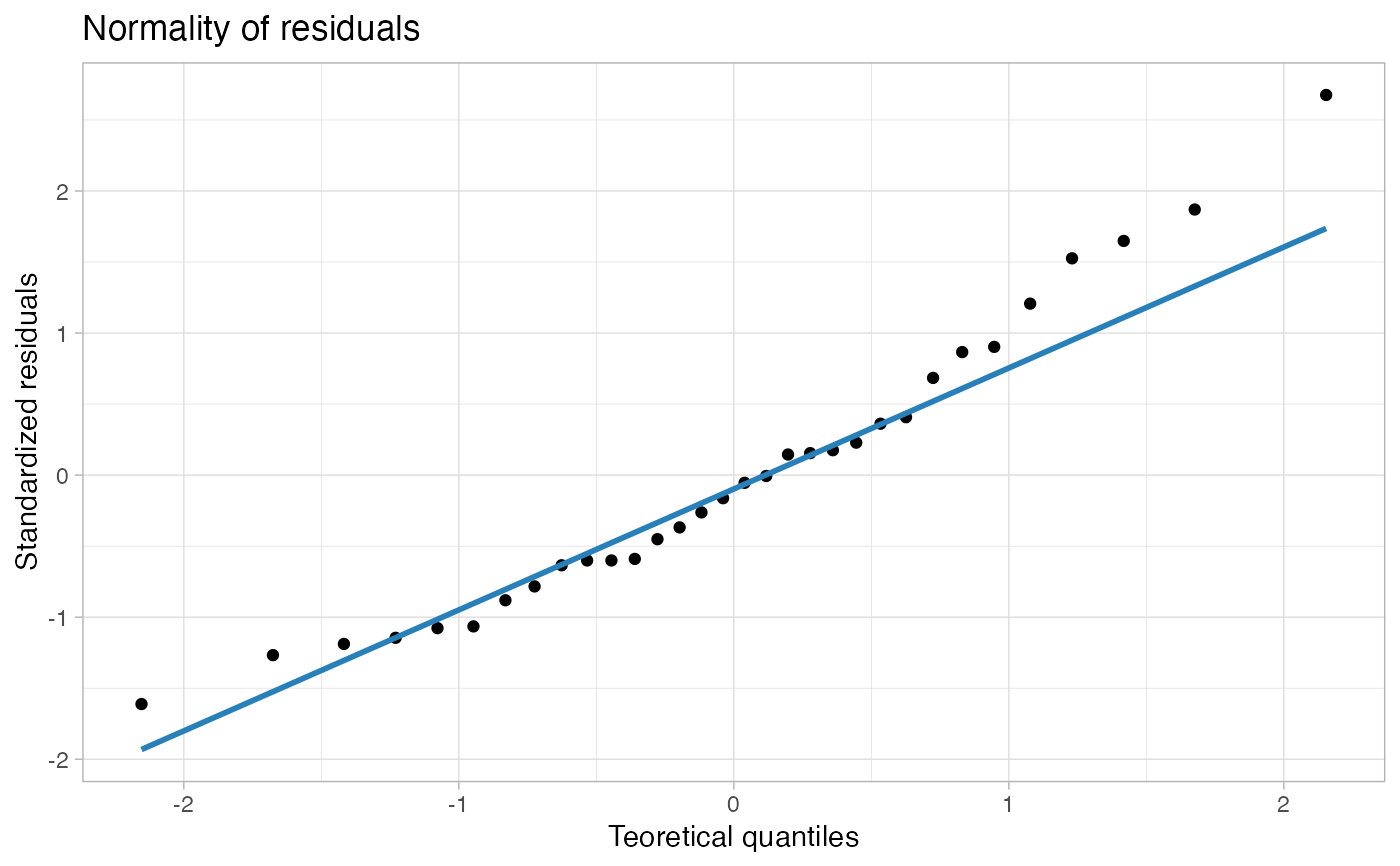
values. plot_model_qq() plots a QQ plot of the model standardized
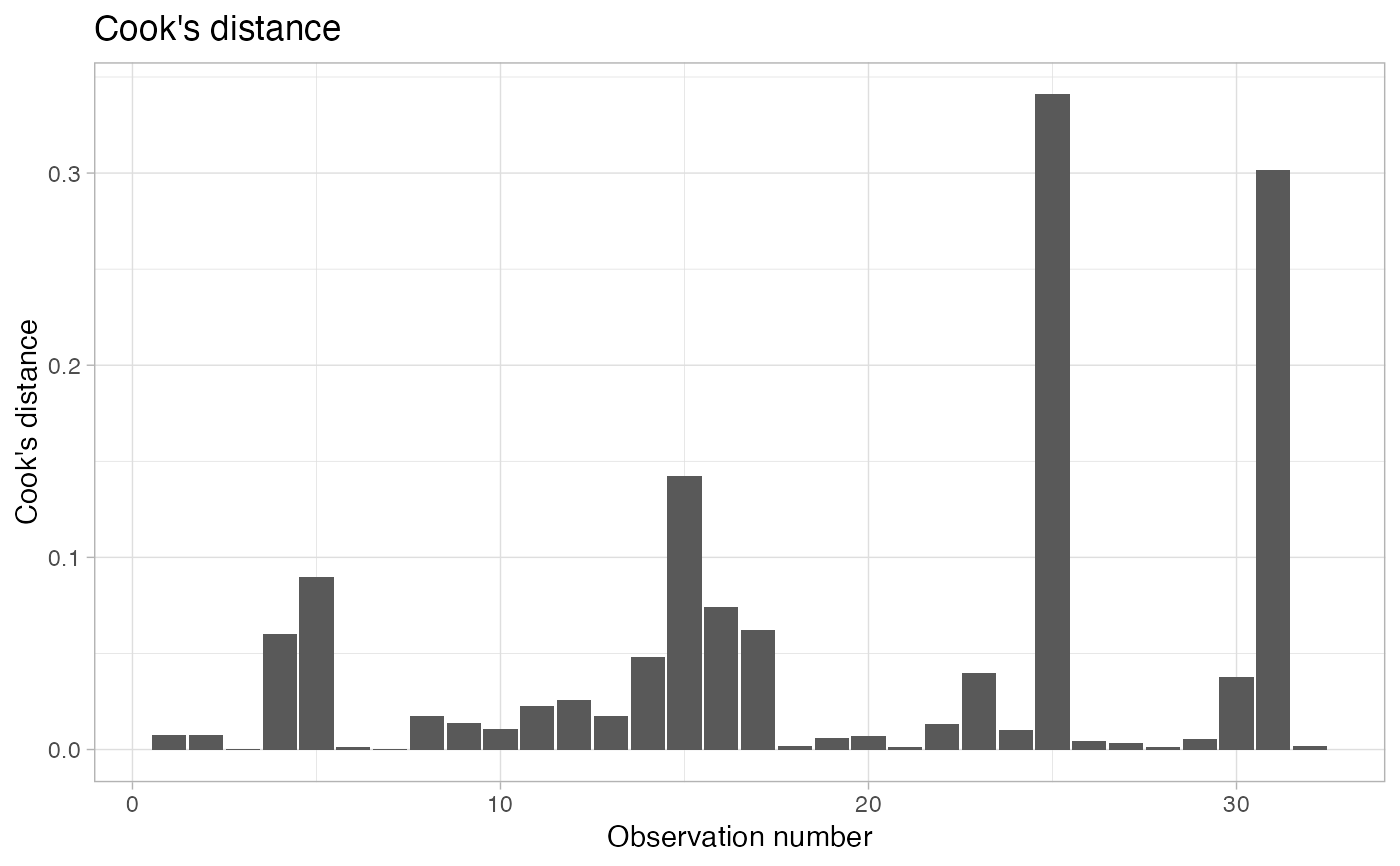
residuals. plot_model_cooks_distance() plots a bat chart of each
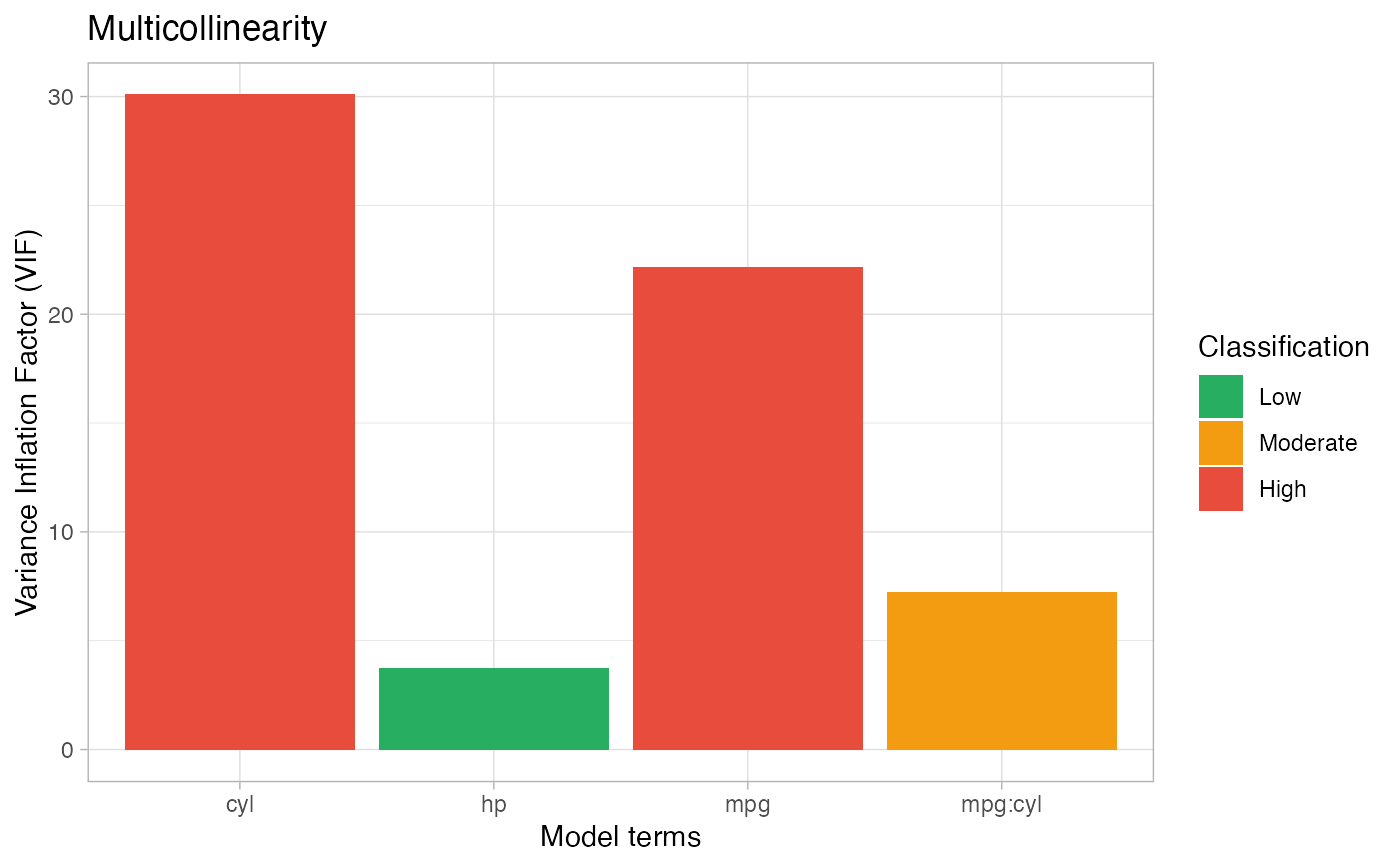
observation Cook's distance value. plot_model_multicollinearity()
plots a bar chart of the variance inflation factor (VIF) for each of the
model terms. plot_model() returns a plot grid with all the
applicable plot diagnostics to a given model.
Examples
plot_model_residual_fitted(m)plot_model_scale_location(m)plot_model_qq(m)plot_model_cooks_distance(m)plot_model_multicollinearity(m)