These functions are intended to be used to quickly generate simple
exploratory plots using the package ggplot2.
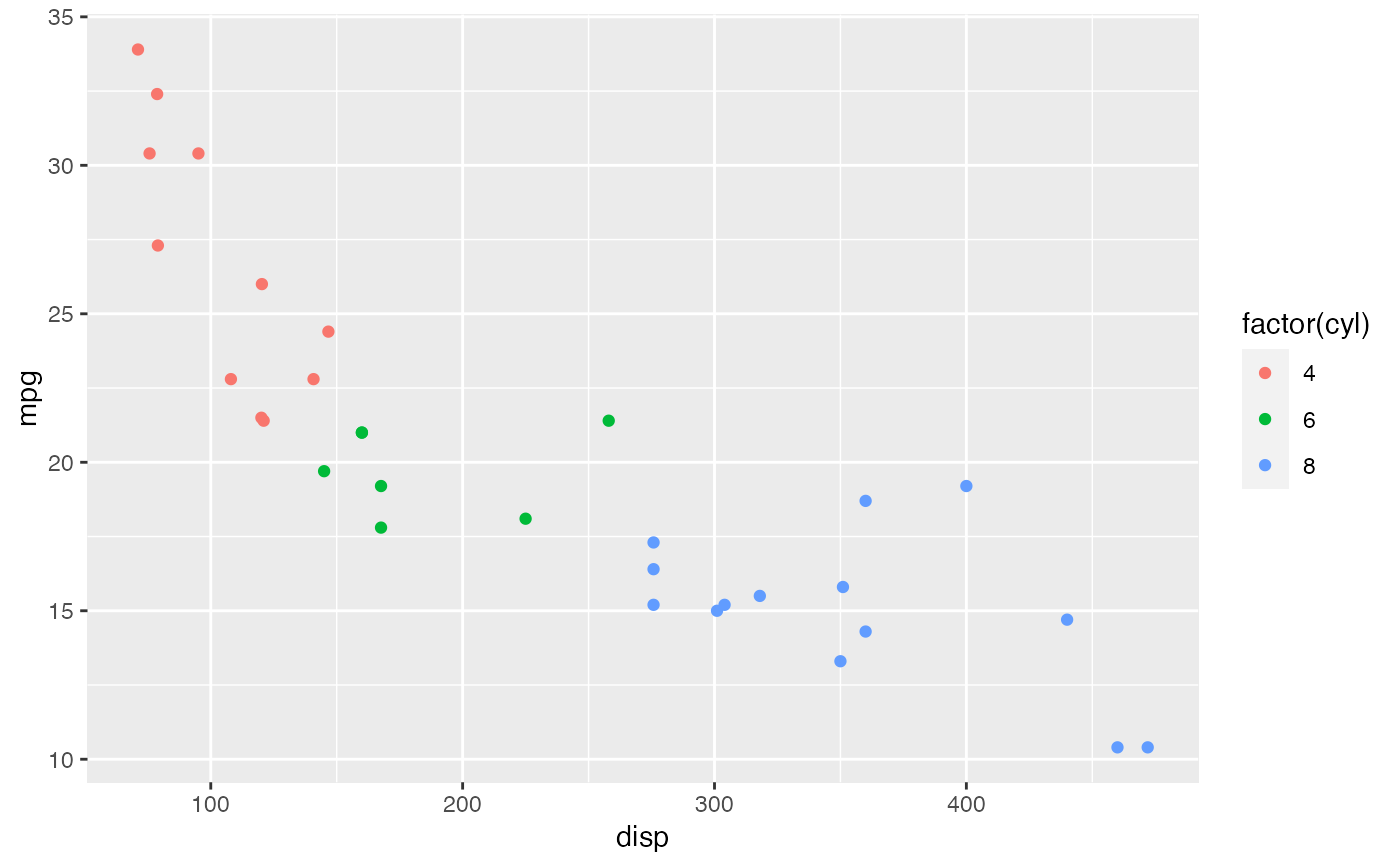
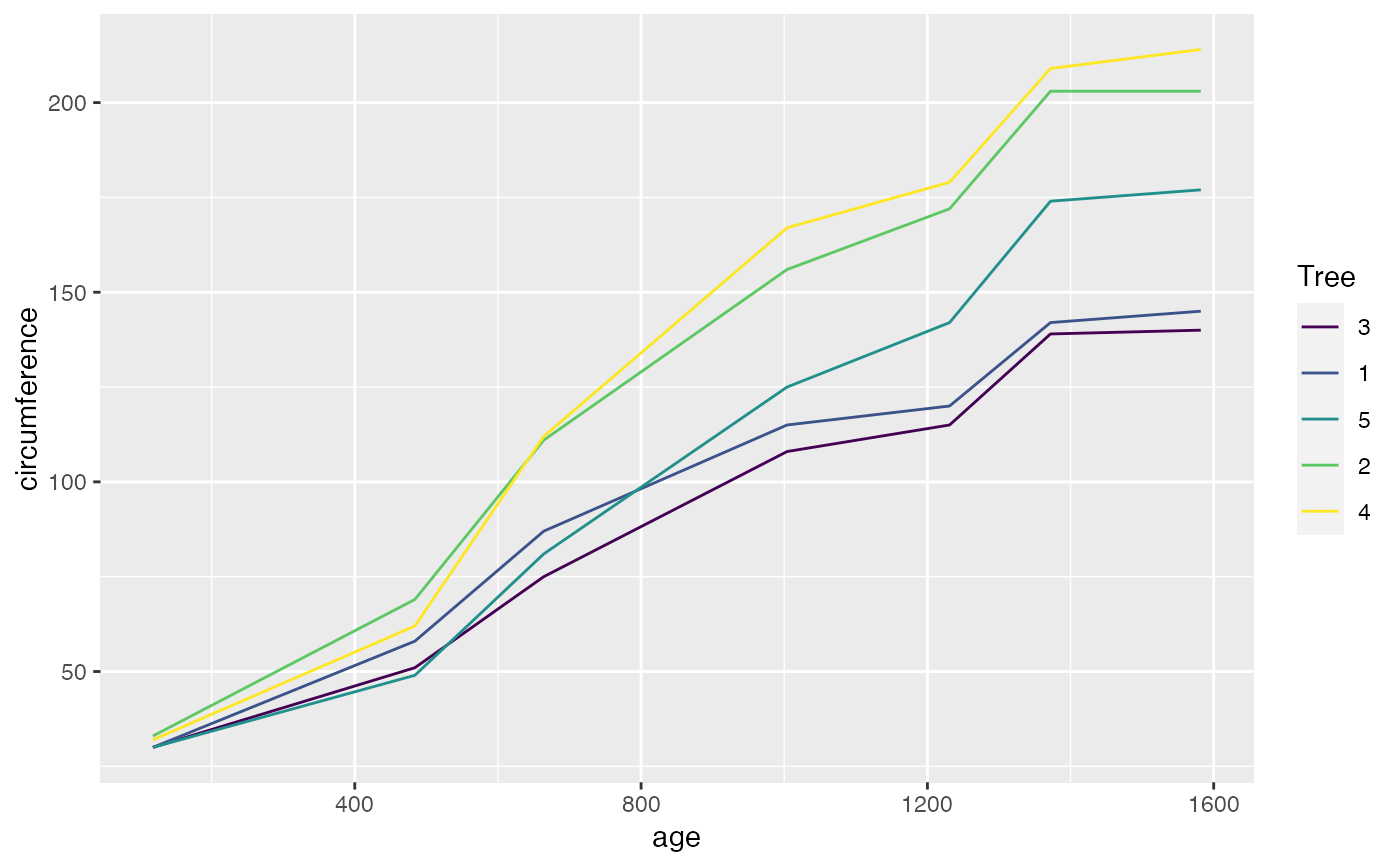
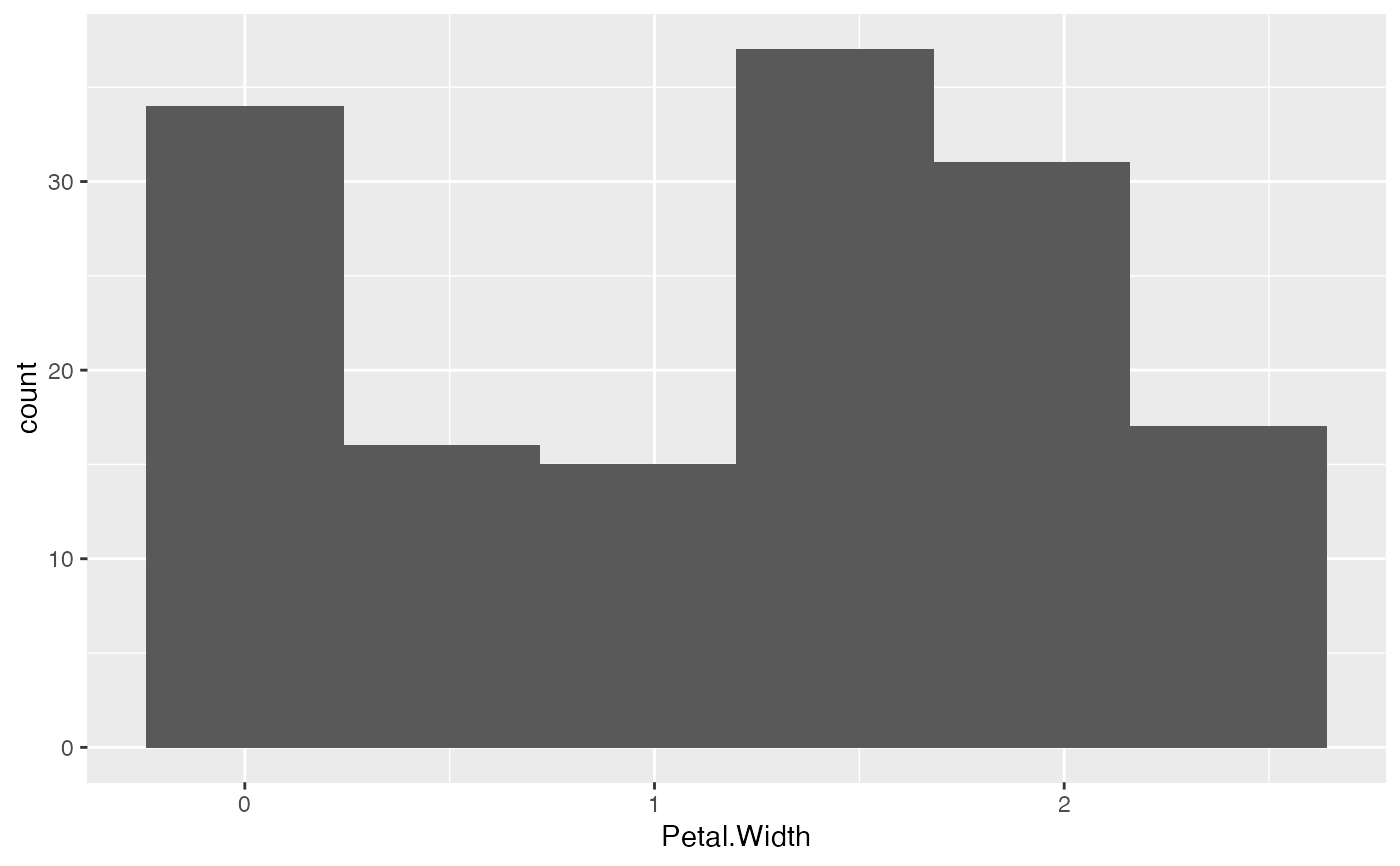
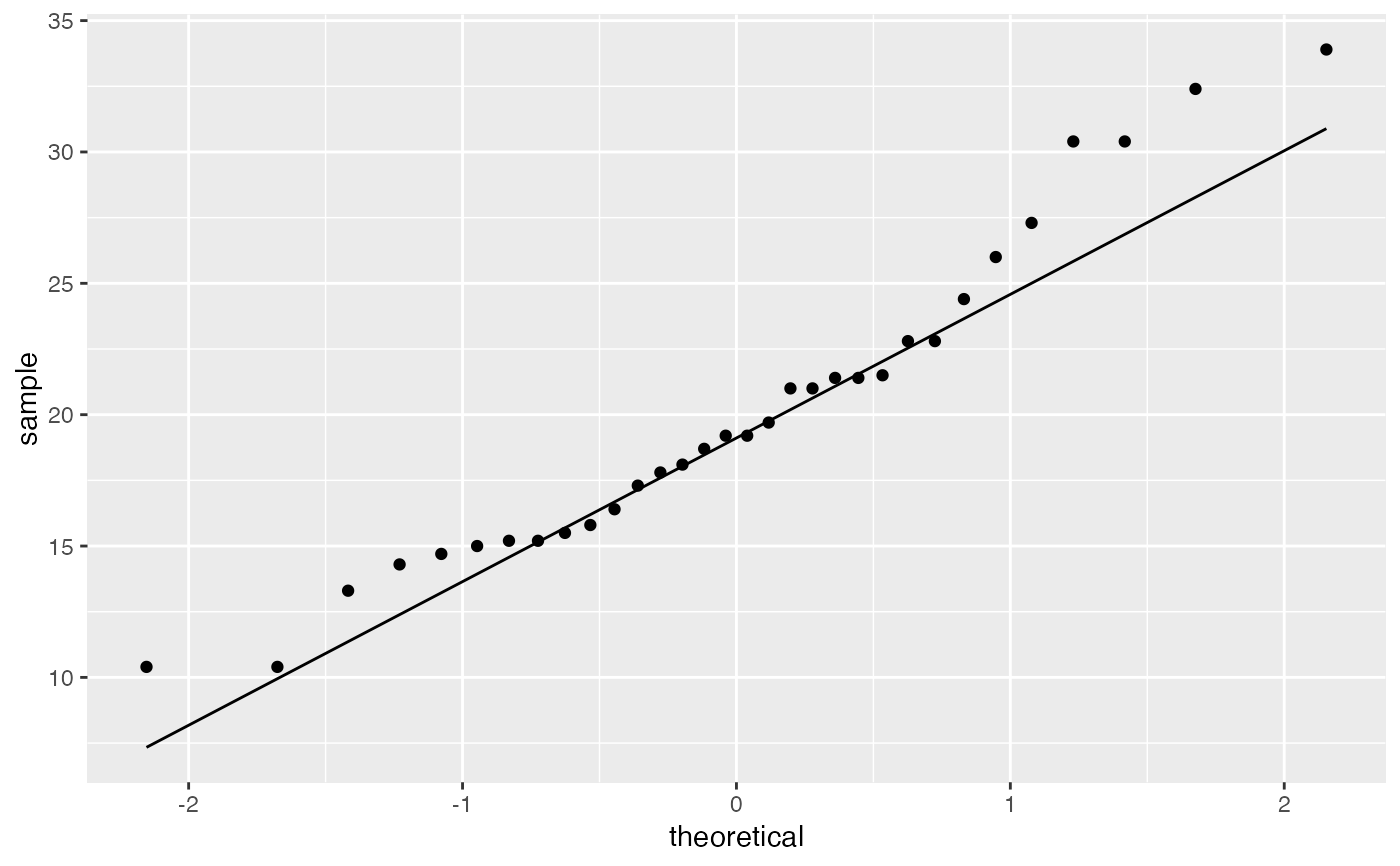
plot_scatter(data, x, y, ...)

plot_line(data, x, y, ...)

plot_hist(data, x, bin_width = NULL, ...)

plot_qq(data, x, ...)
Arguments
| data | A data frame. |
|---|---|
| x, y | x and y aesthetics as the bare (unquoted) name of a column in
|
| ... | Additional arguments to be passed to the |
| bin_width | The width of the bins in a histogram. When |
Value
A ggplot object.
Examples
plot_line(Orange, age, circumference, colour = Tree)plot_hist(iris, Petal.Width, bin_width = "FD")plot_qq(mtcars, mpg)